Shortly after reaching 5120x1440 worth of resolution between my dual monitors, I started searching for uses for all that space. There’s quite a bit of desktop space that frequently winds up unused, neglected, and potentially feeling unloved. From time to time I wind up on /r/battlestations out on Reddit.com and occasionally I’d see a desktop where the owner had nifty little gadgets on their desktop with system information like CPU usage, memory utilization, or hard drive capacity on them. I got curious and dug into those to try and understand where they came from. It seemed like the ones I thought were the most interesting all came from a program called Rainmeter, which I downloaded and put a popular set of skins on my own desktop.
After about a month or so of using Rainmeter I blurted out (to nobody in particular) that it’d sure be nice if it had the information that my Android Piwik notification displays on my phone also on my desktop in a Rainmeter skin. I started doing a bit of “research” into making my own skin to capture and display that same information. Not being especially creative from a visual standpoint, I emulated the design of the default illustro skins which are included with Rainmeter that were created by poiru.
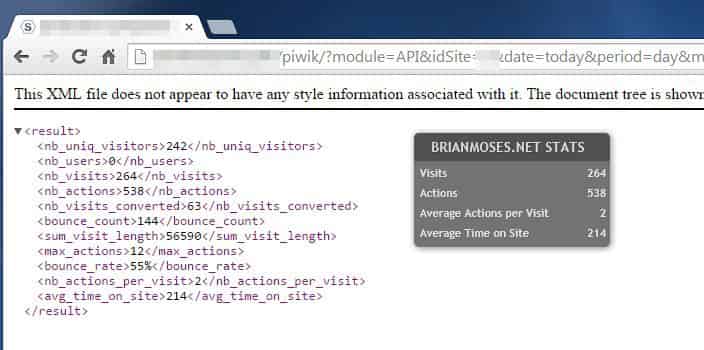
 Ultimately what I wound up doing was using the WebParser plug-in (bundled with Rainmeter) to hit the Piwik API and to pull back the same data I use in my Android Piwik notification. However, instead of using a CSV format I used an XML format and then used a regular expression on what was returned to get the pieces of data that I was most interested in: number of visits, number of actions, average actions per visit, and the average time on site.
I wanted to share it, so I spent some time making it more generic and documenting how other Piwik Users can put it to work for themselves. By default, I have it configured to point at Piwik’s Demo Site so anyone can see it in action right off the bat.
Description
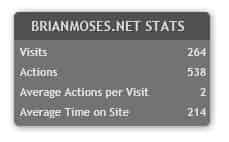
This Piwik skin for Rainmeter is pretty simple. It’s configured to work with your Piwik installation’s API. At a configurable interval, it will query the Piwik API and display the following information from the current day’s traffic:
- Total Visits
- Total Actions
- Average Actions Per Visit
- Average Time On Site (in seconds)
One final feature is that if you clicked the title of the Piwik Skin, it’ll launch the URL of your Piwik installation.
Also available within the Piwik skin, but not currently being output, are the remaining statistics from the Visits Summary Module (below). These could be easily added by editing the skin’s configuration within Rainmeter and emulating what I’ve done to expand the information displayed in the skin.
- Number of unique visitors
- Number of users
- Number of visits converted
- Bounce count
- Total visit length
- Maximum number of actions in a visit
- Bounce rate
In the same vein, the entire Piwik Reporting API is available to you when using Rainmeter. My skin’s intended to be a jumping-off point if you want to dig in and get additional information back from the API and display it in your own version of the skin. It’d be awesome if you described (or even shared) your revisions in the comments below!
Installation Instructions
- Gather the necessary data for the Piwik API a. Piwik URL a. Your Piwik Site ID a. Your Piwik authentication token
- Download and install Rainmeter
- Download and install my Rainmeter Piwik Skin from DeviantArt, GitHub or from my blog
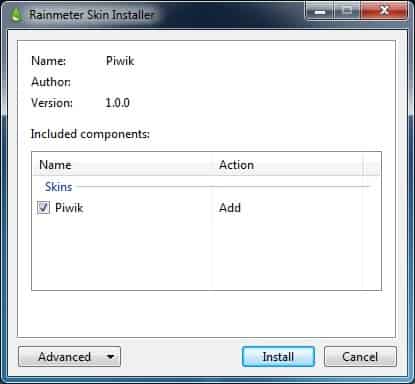
- Locate the downloaded file (Piwik_1.0.0.rmskin), double-click it and click Install.
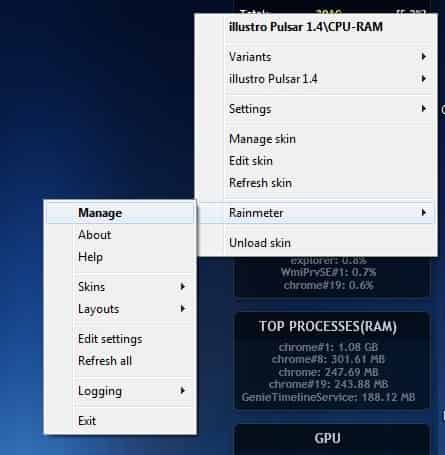
- Right-click the Rainmeter icon in the system tray, or right-click an existing skin on your desktop and navigate to Rainmeter>Manage
-
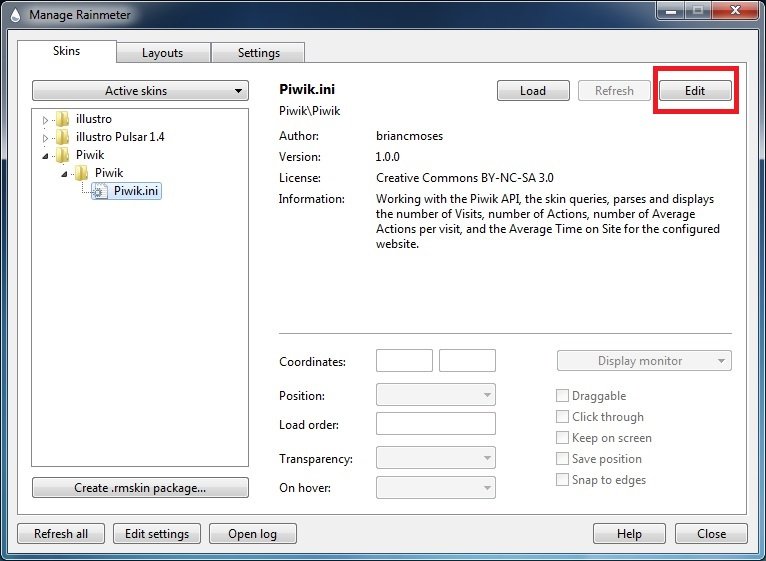
Click Edit and modify the following found under the [Variables] section to match your own Piwik information from Step 1
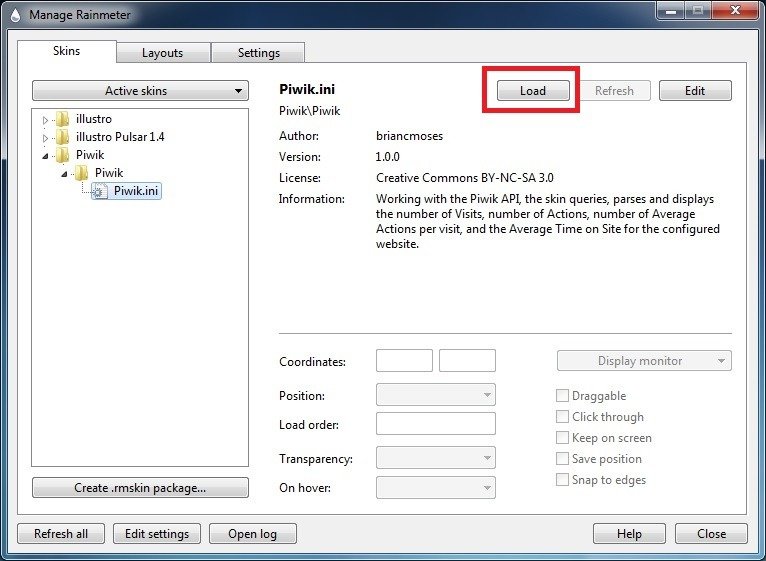
SiteURL="Demo.Piwik.Org" PiwikURL="http://demo.piwik.org" PiwikSiteID=7 PiwikAuthToken="anonymous" - Expand the Piwik folder and sub folder, select Piwik.ini and click Load
What’s Next
In reading over the documentation, I’m a bit intrigued by many of Rainmeter’s other capabilities. I would really like some sort of indicator which indicates throughout the day how my web metrics are looking when compared to historical data. Right now, I think I’d like to conditionally color the text to indicate how I’m performing when compared to the average over the last 30 days. For example, display the value red if its value is lagging too far behind the average for the past 30 days. Similarly, if I’m exceeding the average then change the text color to something exciting like green. I need to tinker Rainmeter and the Piwik API a bit more before I can accomplish that, but it’s on my to-do list.
What about you, what other kinds of Piwik data would you want displayed in a desktop gadget like my Piwik Skin for Rainmeter? Feel free to make requests in the comments, or add your own contributions out on the Piwik Skin for Rainmeter GitHub repro that I created.

